
📉 Mortgage Rates Are Actually Lower This Week – But Timing Matters
Last week’s headlines created confusion: some said rates dropped, others reported a sharp spike. Surprisingly, both were right — but timing was everything.
-
Survey-based data (like Freddie Mac and MBA) showed lower rates because they missed the recent spike.
-
In real time, rates hit long-term lows on April 4th and jumped to the highest levels since February by April 11th.
-
Now, rates have dropped back down into the high-6% range on a daily basis.
-
Weekly averages, however, are also in the high 6s — but only because they jumped from the mid-6s, not because of a recent drop.
📊 This difference in reporting shows why daily data can provide a more accurate picture than weekly surveys.
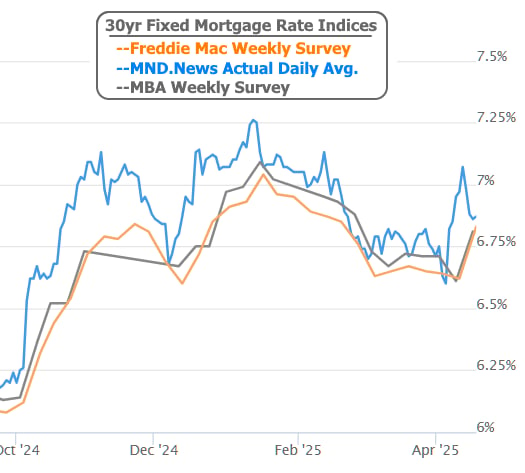
Daily vs. Weekly Mortgage Rate Trends | Source: NEXA Mortgage
🏦 Federal Reserve & Economic Outlook
The Fed continues to walk a tightrope between supporting growth and controlling inflation.
-
Jerome Powell (Fed Chair): "The current outlook is highly uncertain," citing elevated risks of both higher unemployment and rising inflation.
➤ Source: Reuters -
On tariffs, Powell said they could increase inflation while also weakening the economy — conflicting signals for rate decisions.
➤ Source: The Times -
Beth Hammack (Cleveland Fed President): "High levels of uncertainty argue for steady monetary policy while we gather more data."
➤ Source: Reuters
👉 Until the Fed finalizes its direction, mortgage rate volatility may continue.
Key Takeaways for Buyers & Sellers
-
Buyers: Recent drops in rates could improve affordability — but move quickly as volatility continues.
-
Sellers: More buyers are jumping in, thanks to improved rates. Good time to list strategically.
-
Agents: Keep a close eye on daily mortgage trends, not just weekly headlines.
📊 BONUS MARKET SNAPSHOT: Inventory & Days on Market
Inventory Levels:
-
U.S. housing inventory reached 1.1 million in March 2025 — up 12% year-over-year.
-
This signals a shift toward a more balanced market, giving buyers more options.
Median Days on Market (DOM):
-
National median DOM:
-
March 2025: 53 days
-
February: 66 days
-
January: 73 days
➤ Source: FRED St. Louis Fed
-
-
Florida DOM:
-
Now averages 41 days, compared to just 12 days during the peak COVID market
➤ Source: Moving to Florida Guide
-
🧭 These figures reflect a return to normalcy, with homes taking longer to sell than in recent years but still moving at a healthy pace.
Want to know how these trends impact your neighborhood or your home’s value?
I’d be happy to help, just text or give me a call.